Guide to Research Triangle Park: a K-means application
Tools used: R programming: for coding Adobe illustrator: for editing chart or plot
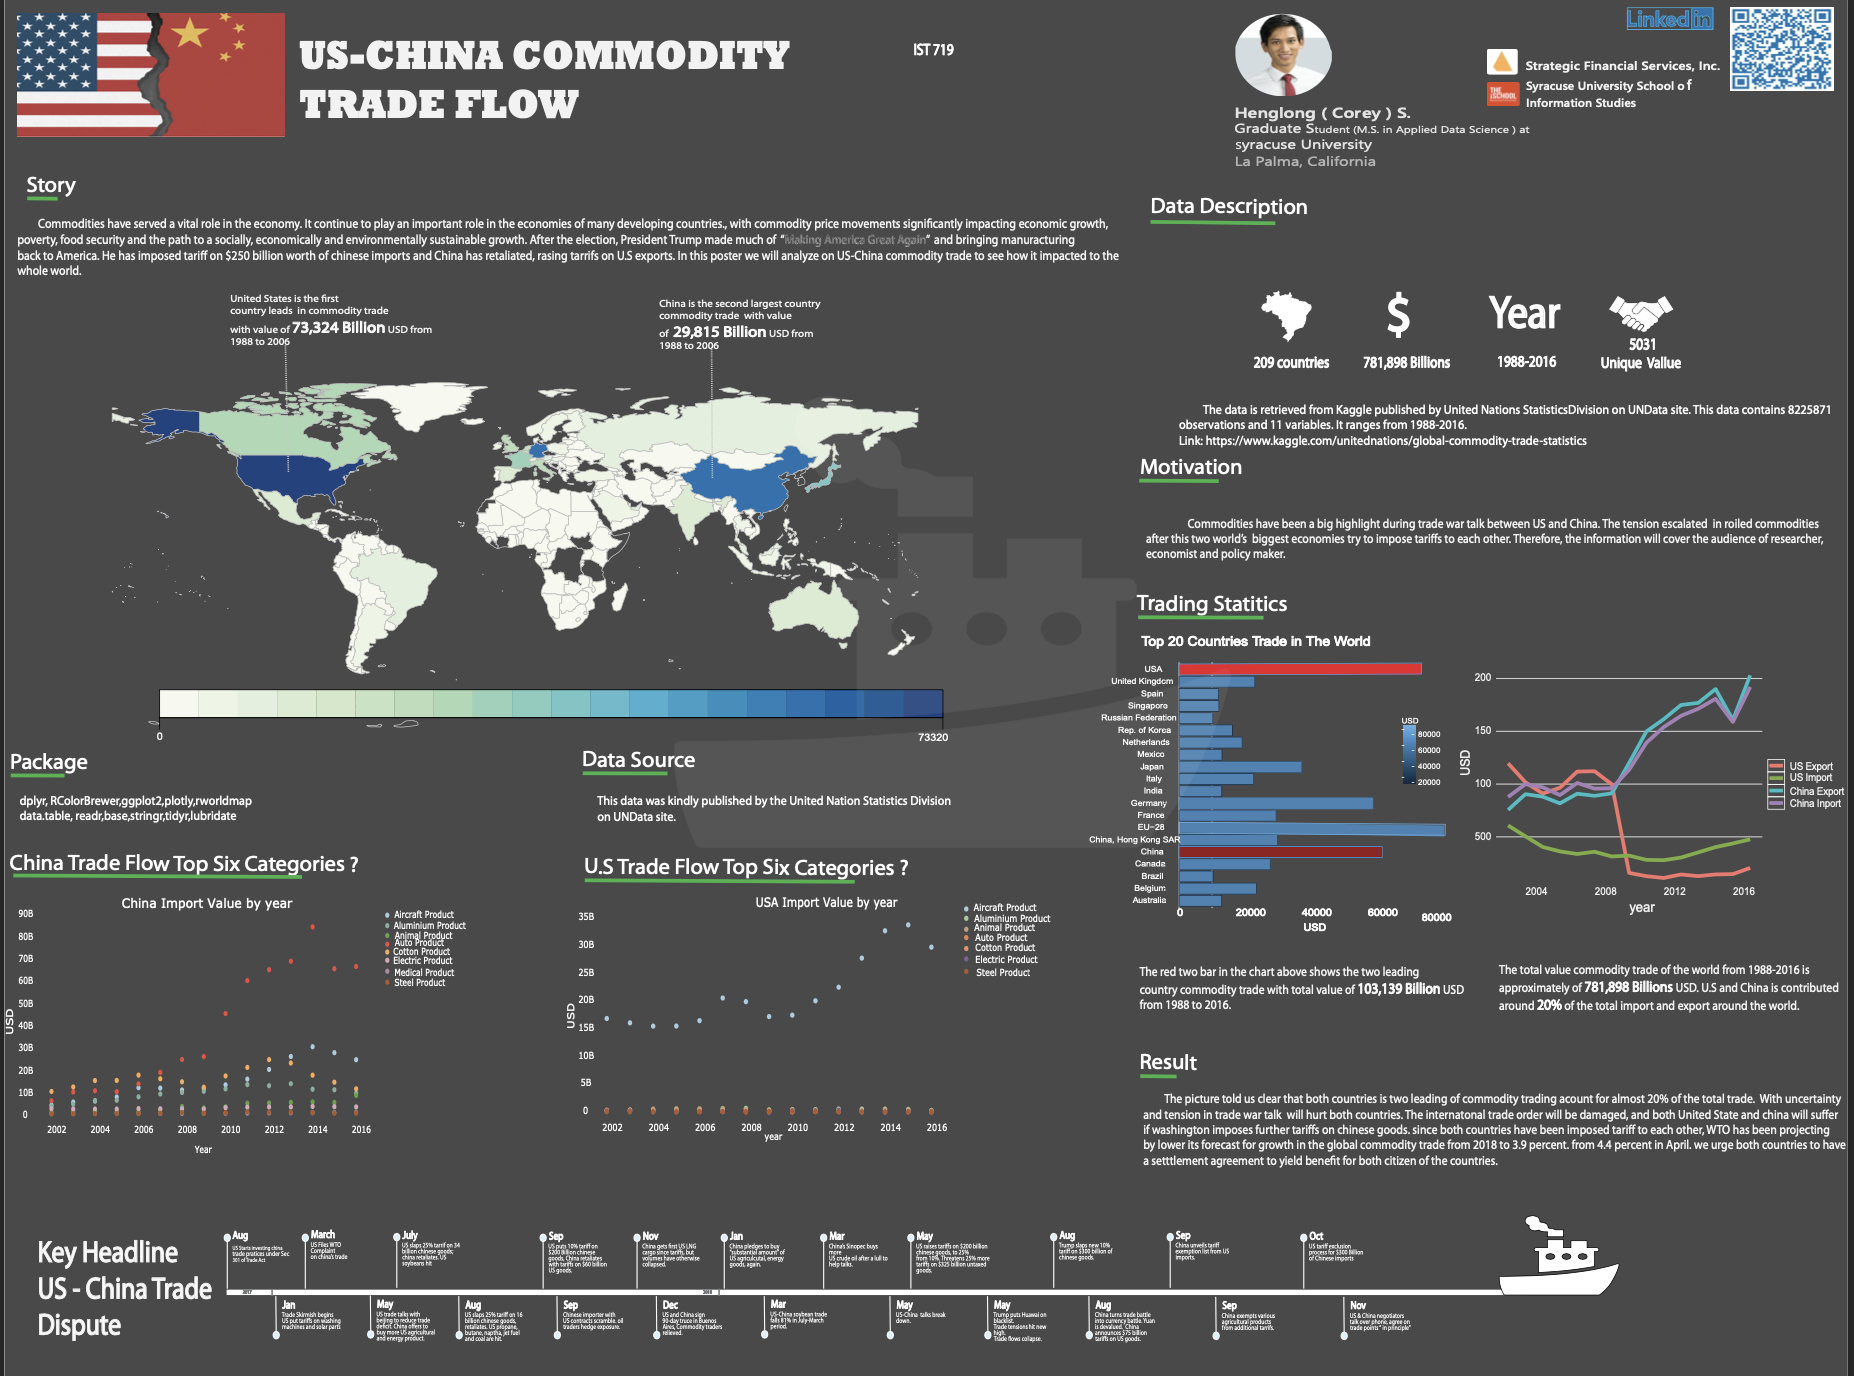
Global Commodity Trade Statistics This assignment deal with visualization of global commodity trade statistics which is a collection of 5,000 commodities across most countries in the world over the last 30 years. The goal is to find the best interesting factors from this dataset to give the audience most insightful information. Dataset description: This file were provided by United Nation Statistics Division on the UNData site http://data.un.org/Explorer.aspx.